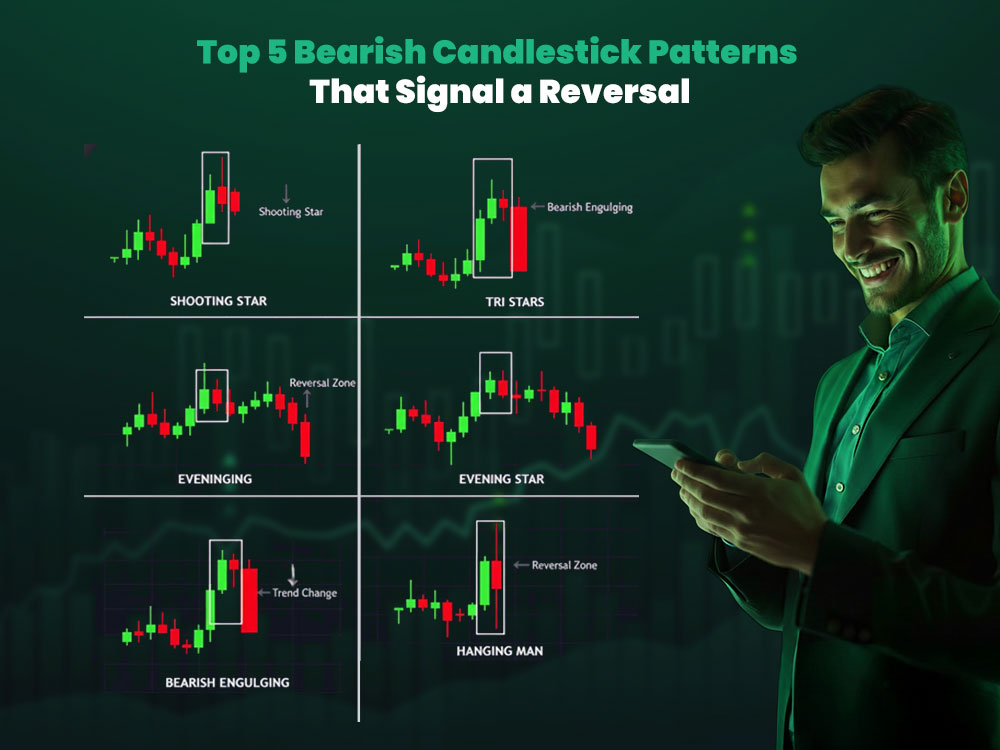
Top 5 Bearish Candlestick Patterns That Indicate a Reversal
Spotting bearish candlestick patterns is one of the most reliable ways to anticipate a market reversal. These patterns highlight a shift in market sentiment, signaling that buying pressure is weakening while selling pressure is gaining momentum.
Each bearish candlestick tells a story: buyers are losing control, and sellers are stepping in with strength. Traders who can interpret these signals gain an early advantage ahead of significant trend changes.
In this guide, we’ll explore the top 5 bearish candlestick patterns that consistently indicate reversals. You’ll learn how each pattern forms, what it represents, and how to confidently apply it to your charts.
These setups are effective across all markets—forex, stocks, and crypto—and on any timeframe. For traders seeking professional-grade execution, Dominion Markets offers fast trade execution, tight spreads, and platforms like MetaTrader 5, providing the ideal environment to apply these bearish reversal patterns with precision.
Get high-accuracy trading signals delivered directly to your Telegram. Subscribe to specialized packages tailored for the world’s top markets:
Free Crypto Signals Subscribe via Telegram
Free Forex Signals Subscribe via Telegram
Free VIP Signals (Gold, Oil, Forex, Bitcoin, Ethereum, Indices) Subscribe via Telegram
Free Trading Acoount Open With ORON LIMITED Signals (Gold, Oil, Forex, Bitcoin, Ethereum, Indices)
Open Account
Not profitable? Don’t worry! Join our copy trading system where we provide lower risk returns. Benefits of Joining Us:
-Lesser Risk as lot size is minimal
-Higher returns (approx. 5% to 10% monthly)
-Easy Deposit and Withdrawal with USDT using crypto wallets
-Lesser Drawdown
-Instant Support
-Invest Now and get guaranteed returns with us. DM us for more info❤️
-Start Now
*Copy Trading is free but we charge some percentage of profit as fees.*
Full VIP signals performance report for September 22–26, 2025:
Bearish Engulfing Pattern
The bearish engulfing is one of the most widely recognized bearish candlestick patterns, often signaling a potential market top. It’s decisive and clearly shows when sellers have gained control.
How It Forms
- The first candle is bullish, indicating buyers are still in control.
- The second candle is a strong bearish candle that opens above the previous candle’s close but closes below its low.
- This second candle completely “engulfs” the body of the first candle.
This action indicates that sellers have overpowered buyers, suggesting prices may move lower.
What It Signals
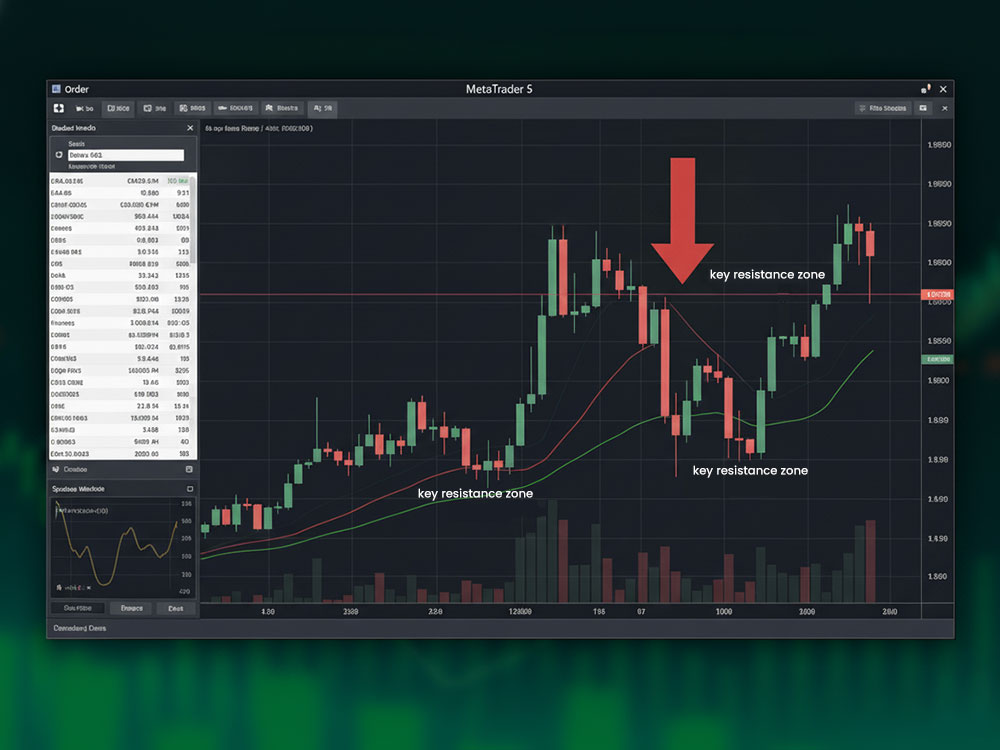
A bearish engulfing pattern represents a shift in market power. It’s particularly effective when it appears at resistance levels or after an extended uptrend. For a detailed trading guide, see our article on the bearish engulfing candlestick pattern.
Example Scenario
Imagine EUR/USD has been rallying for several days. Suddenly, a large red candle forms that fully engulfs the previous bullish candle, accompanied by rising volume. This pattern signals that buyers are exhausted and sellers are taking over.
Traders often enter short positions after the candle closes, placing stop-loss orders above the engulfing candle’s high.
Trading Checklist
- Confirm the pattern appears near resistance or supply zones.
- Ensure the close breaks below the prior candle’s low.
- Prefer higher timeframes like 4H or Daily for more reliable signals.
Market Psychology
This pattern reflects trapped buyers. The uptrend continues until sellers gain control, resulting in a sudden momentum shift that may trigger a new downtrend.
Shooting Star
The shooting star is a strong bearish candlestick signal, often appearing near the end of an uptrend. It serves as a single-candle warning that the market may be reversing.
Characteristics
- Small body near the lower end of the candle.
- Long upper shadow (at least twice the size of the body).
- Little or no lower shadow.
What It Means
The long upper wick indicates that buyers attempted to push prices higher but failed, as sellers quickly stepped in and forced the candle to close near its open. This pattern visually represents rejection of higher prices, signaling that the uptrend may be losing momentum.
Example Scenario
After a week of gains, GBP/USD forms a shooting star near resistance with a long upper wick. The following candle opens lower and turns bearish, confirming seller activity. Traders often view this as an opportunity to enter short positions, placing stop-loss orders above the candle’s high.
Trading Checklist
- Wait for confirmation from the next candle.
- Combine with RSI divergence or trendline rejection for added reliability.
- Works best near key resistance levels or supply zones.
Market Psychology
The shooting star reflects buyers losing control. The long upper wick shows sellers testing the market’s limits and prevailing, while the small body indicates that bulls exhausted their momentum. This setup often precedes a trend reversal.
Get high-accuracy trading signals delivered directly to your Telegram. Subscribe to specialized packages tailored for the world’s top markets:
Free Crypto Signals Subscribe via Telegram
Free Forex Signals Subscribe via Telegram
Free VIP Signals (Gold, Oil, Forex, Bitcoin, Ethereum, Indices) Subscribe via Telegram
Free Trading Acoount Open With ORON LIMITED Signals (Gold, Oil, Forex, Bitcoin, Ethereum, Indices)
Open Account
Not profitable? Don’t worry! Join our copy trading system where we provide lower risk returns. Benefits of Joining Us:
-Lesser Risk as lot size is minimal
-Higher returns (approx. 5% to 10% monthly)
-Easy Deposit and Withdrawal with USDT using crypto wallets
-Lesser Drawdown
-Instant Support
-Invest Now and get guaranteed returns with us. DM us for more info❤️
-Start Now
*Copy Trading is free but we charge some percentage of profit as fees.*
Full VIP signals performance report for September 22–26, 2025:
Evening Star
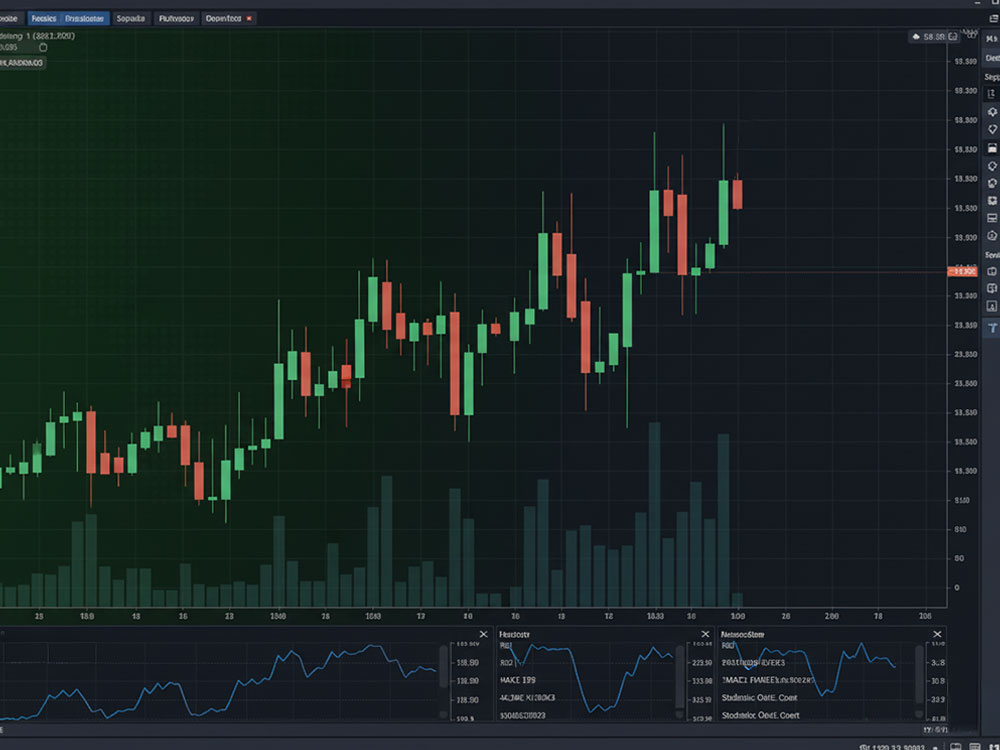
The evening star is one of the most reliable classic bearish reversal patterns. This three-candle formation signals the potential end of bullish momentum and the beginning of a downtrend.
Structure
- First candle: Strong bullish candle, showing buyers in control.
- Second candle: Small-bodied candle (often a doji) indicating indecision.
- Third candle: Large bearish candle that closes well into the body of the first candle.
Interpretation
The pattern demonstrates a gradual weakening of buying pressure. The indecision in the second candle, followed by a decisive bearish close, confirms a bearish reversal setup.
Example Scenario
A stock rallies for a week, forming a large green candle. This is followed by a small indecision candle, then a large red candle that erases most of the previous gains. This sequence completes the evening star pattern, signaling the start of a potential downtrend.
Trading Checklist
- Look for the pattern near resistance or supply zones.
- Confirm with the strong close of the third candle.
- Combine with RSI divergence to strengthen the signal.
Market Psychology
The evening star captures the emotional cycle of the market: excitement, hesitation, and then panic. Early buyers become trapped at the top, while sellers take control. This makes it one of the most powerful bearish reversal patterns across all timeframes.
Dark Cloud Cover
The dark cloud cover pattern typically emerges when an uptrend begins to lose momentum. This two-candle bearish pattern signals a strong rejection of higher prices.
How It Forms
- The first candle is large and bullish.
- The second candle opens above the first candle’s high (creating a small gap up) but closes below the midpoint of the first candle’s body.
What It Means
The failed gap shows that buyers initially dominated but were unable to sustain control. Sellers stepped in, pushing the price down for a deep close. When the second candle closes more than halfway into the first candle’s body, it confirms a bearish reversal setup.
Example Scenario
USD/JPY has been rising steadily. One day, a large green candle forms, followed by a strong red candle that closes well below the first candle’s midpoint. This sequence forms a dark cloud cover pattern, signaling a potential reversal.
Trading Checklist
- Wait for the next candle to confirm the downtrend.
- Focus on key resistance levels for higher accuracy.
- Look for volume spikes to strengthen the signal.
Market Psychology
The pattern reflects optimism turning into disappointment. Traders who bought during the initial gap become trapped as the price reverses, and their collective exit helps drive further downward momentum.
Get high-accuracy trading signals delivered directly to your Telegram. Subscribe to specialized packages tailored for the world’s top markets:
Free Crypto Signals Subscribe via Telegram
Free Forex Signals Subscribe via Telegram
Free VIP Signals (Gold, Oil, Forex, Bitcoin, Ethereum, Indices) Subscribe via Telegram
Free Trading Acoount Open With ORON LIMITED Signals (Gold, Oil, Forex, Bitcoin, Ethereum, Indices)
Open Account
Not profitable? Don’t worry! Join our copy trading system where we provide lower risk returns. Benefits of Joining Us:
-Lesser Risk as lot size is minimal
-Higher returns (approx. 5% to 10% monthly)
-Easy Deposit and Withdrawal with USDT using crypto wallets
-Lesser Drawdown
-Instant Support
-Invest Now and get guaranteed returns with us. DM us for more info❤️
-Start Now
*Copy Trading is free but we charge some percentage of profit as fees.*
Full VIP signals performance report for September 22–26, 2025:
Hanging Man
The hanging man resembles a hammer but appears at the top of an uptrend. It is one of the simplest yet often overlooked bearish candlestick patterns.
How to Recognize It
- Small body near the upper range of the candle.
- Long lower shadow — at least twice the body length.
- Little or no upper shadow.
What It Suggests
Even though the candle closes near its open, the long lower shadow indicates that sellers pushed prices sharply downward before buyers regained control. This intraday selloff exposes underlying weakness within the bullish trend.
Example Scenario
Gold rises steadily over several sessions. A hanging man forms on the daily chart, followed by a bearish red candle the next day. This sequence signals a potential trend reversal and may present short entry opportunities.
Trading Checklist
- Wait for confirmation from the following candle.
- Works best near resistance levels or trendline tops.
- Combine with overbought RSI readings for stronger confluence.
Market Psychology
The hanging man highlights a hidden shift in market sentiment. Sellers tested the uptrend and nearly broke it. Buyers managed only a weak recovery, signaling cracks beneath the bullish momentum.
Confirming Bearish Reversals
Bearish candlestick patterns become more reliable when validated by broader technical context. Always combine them with additional signals for higher accuracy.
1. Check the Trend
Bearish patterns are most significant after a clear uptrend. Without a preceding rise, a pattern may indicate only short-term consolidation rather than a reversal.
2. Identify Resistance Zones
Patterns forming near resistance or supply zones are more trustworthy. For example, a bearish engulfing at a weekly resistance level often marks a market top.
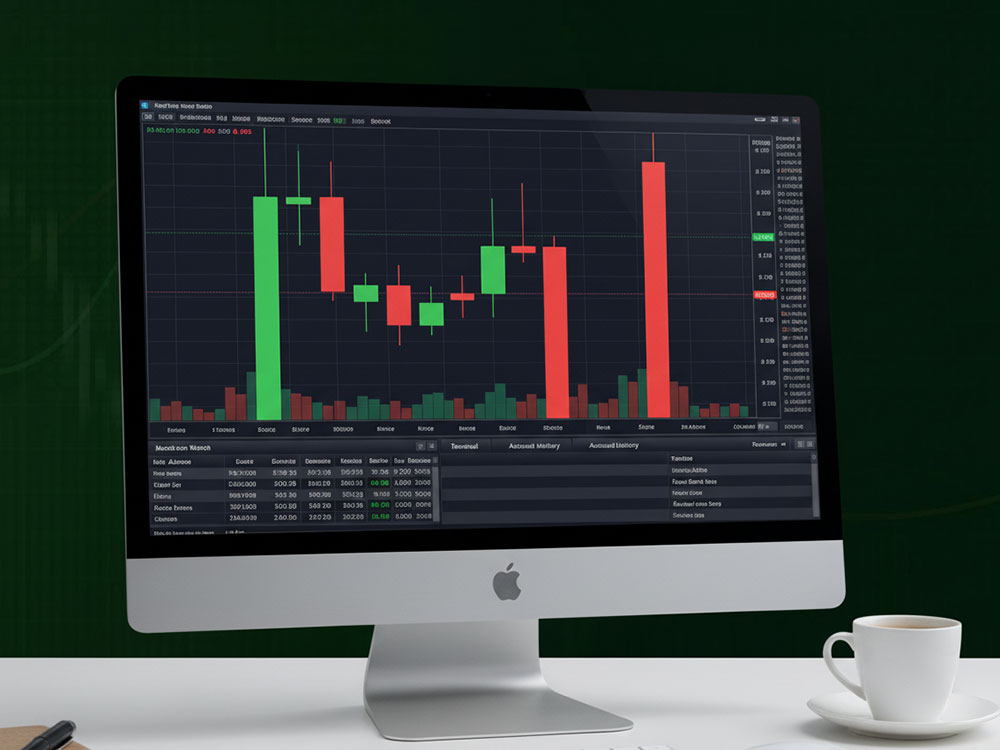
3. Volume Confirmation
Strong volume during the bearish candle indicates genuine selling pressure, providing critical confirmation.
4. Combine with Indicators
Use tools like RSI or MACD to identify divergence. A bearish reversal forming when RSI is overbought increases the probability of a trend change.
5. Wait for the Candle Close
Always wait for the candle to close before acting. Mid-session moves can be misleading, but the close often confirms the pattern’s validity. For additional context, see how the bearish harami forms after a strong uptrend, signaling a slowdown before sellers dominate.
Example: Combining Bearish Patterns in Action
Example: Trading Bearish Reversal Patterns in Action
Imagine EUR/USD in a strong uptrend approaching a weekly resistance zone. A shooting star forms on the daily chart, followed the next day by a bearish engulfing candle, with RSI also showing divergence.
Here’s how to approach this bearish chart setup:
- Confirm the pattern near a resistance level.
- Wait for the bearish engulfing candle to close.
- Enter a short position with a stop-loss above the engulfing candle’s high.
- Set your target at the next support level, aiming for a 2:1 reward-to-risk ratio.
This combination of multiple bearish reversal patterns, along with confluence from indicators, provides a high-probability trading opportunity.
Common Mistakes to Avoid with Bearish Candlestick Patterns
Even the strongest bearish patterns can fail if misused. Avoid these common errors:
- Ignoring context: Patterns carry little weight in sideways markets.
- Skipping confirmation: Always wait for the close or a follow-up candle.
- Using small timeframes: Stick to 4H or Daily charts for reliability.
- Forcing patterns: Not every large candle is a valid signal.
- Neglecting risk management: Always define stop-loss and target levels.
Why Bearish Candlestick Patterns Work
Markets are driven by crowd psychology. Bearish reversal patterns reflect the shift from fear to greed — or vice versa.
- Long wicks show rejection of higher prices.
- Candle bodies show conviction of sellers.
- Sequence of candles indicates a shift from buying to selling pressure.
These patterns work across all markets and timeframes because human behavior remains consistent.
Additional Tools to Confirm Bearish Patterns
To improve accuracy and avoid false signals, combine bearish candlestick patterns with:
- Trendlines: Confirm breaks or rejections at key levels.
- Fibonacci retracements: Levels like 61.8% and 78.6% often align with reversals.
- Moving averages: 21 EMA or 50 EMA can act as dynamic resistance.
- Supply zones: Bearish patterns forming in these areas have higher probability.
- Multi-timeframe analysis: Signals confirmed across multiple timeframes (e.g., daily and 4H) are stronger.
When to Ignore a Bearish Pattern
Even a perfect-looking pattern may not be tradable under certain conditions:
- The trend is too strong to reverse.
- The pattern forms mid-range without a clear level.
- Low volume or flat volatility.
- The next candle fails to confirm the move.
Patience is key — wait for alignment before entering.
Summary Table of Key Bearish Reversal Patterns
| Pattern | Structure | Key Signal | Ideal Location | Confirmation |
|---|---|---|---|---|
| Bearish Engulfing | Two candles | Strong power shift | Resistance | Close below prior low |
| Shooting Star | Single candle | Sharp rejection | Near resistance | Next candle closes red |
| Evening Star | Three candles | Fading momentum | Uptrend top | Third candle closes deep red |
| Dark Cloud Cover | Two candles | Failed gap-up | Supply zone | Close below midpoint |
| Hanging Man | Single candle | Weak buyer recovery | Market top | Next candle bearish |
These five bearish reversal setups consistently help traders spot market tops and protect profits.
Conclusion
Bearish candlestick patterns are among the simplest yet most effective tools for spotting reversals. They visualize market psychology — optimism fading and selling pressure building.
When combined with resistance levels, volume confirmation, and follow-up candles, these patterns help traders identify high-probability entries with precision.
The five patterns discussed — Bearish Engulfing, Shooting Star, Evening Star, Dark Cloud Cover, and Hanging Man — appear across all markets and timeframes. Using them alongside disciplined risk management allows traders to act with confidence rather than guesswork.
Pro Tip: Dominion Markets provides tight spreads, fast execution, and platforms like MT5 to test these strategies live, ensuring smooth order execution and strategy implementation.
Understanding how to read each bearish candle gives traders a real edge. While patterns don’t predict the future, they reveal the truth about market momentum — often enough to spot reversals before the crowd.
FAQs About Bearish Candlestick Patterns
- What are bearish candlestick patterns?
- How do you confirm a bearish reversal candlestick?
- Which is the strongest bearish pattern?
- Can bearish candlestick patterns fail?
- Do bearish reversal patterns work on all timeframes?
- What’s the difference between a bearish candle and a bearish pattern?
- Are these patterns effective in forex trading?
Get high-accuracy trading signals delivered directly to your Telegram. Subscribe to specialized packages tailored for the world’s top markets:
Free Crypto Signals Subscribe via Telegram
Free Forex Signals Subscribe via Telegram
Free VIP Signals (Gold, Oil, Forex, Bitcoin, Ethereum, Indices) Subscribe via Telegram
Free Trading Acoount Open With ORON LIMITED Signals (Gold, Oil, Forex, Bitcoin, Ethereum, Indices)
Open Account
Not profitable? Don’t worry! Join our copy trading system where we provide lower risk returns. Benefits of Joining Us:
-Lesser Risk as lot size is minimal
-Higher returns (approx. 5% to 10% monthly)
-Easy Deposit and Withdrawal with USDT using crypto wallets
-Lesser Drawdown
-Instant Support
-Invest Now and get guaranteed returns with us. DM us for more info❤️
-Start Now
*Copy Trading is free but we charge some percentage of profit as fees.*
Full VIP signals performance report for September 22–26, 2025:
